Blood Sugar & Metabolic Health
Blood sugar isn't a number — it's a curve, redrawn with every meal. The healthy curve rises, returns, and repeats; the modern refined-carb curve spikes, overshoots, crashes, and demands another hit — the loop behind the 3pm crash. This page is the hour-by-hour view: the mechanics, the stackable levers that flatten the curve, the numbers ladder that turns 'fine' into measurable, and the honest grade for the glucose-monitoring trend.
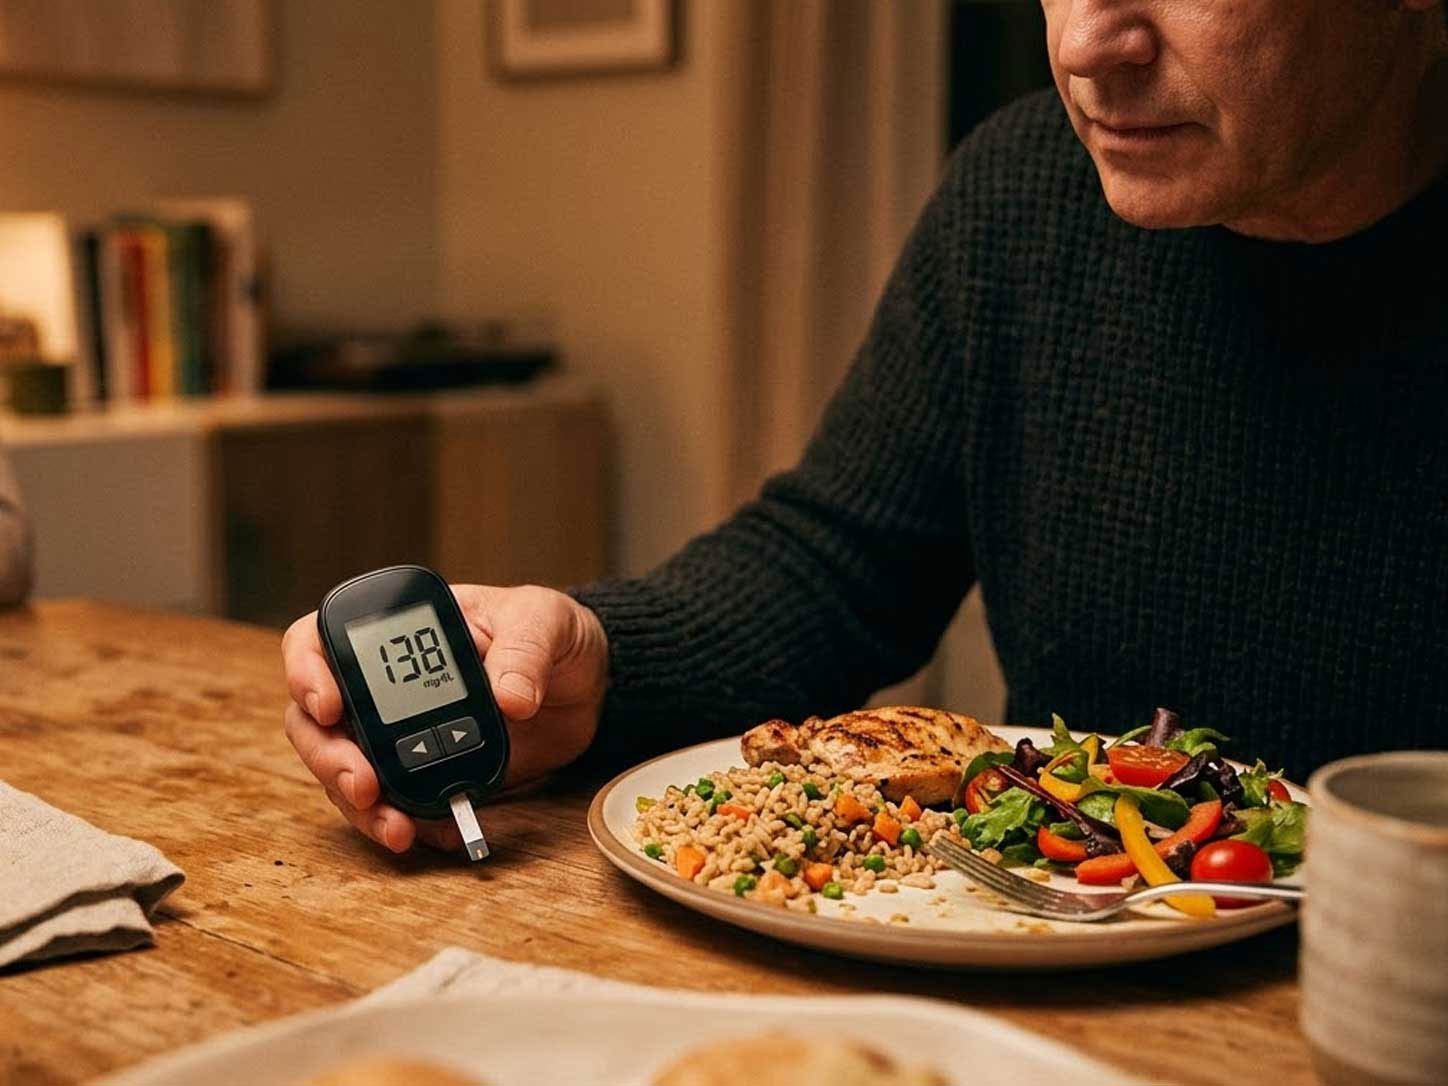
The curve, the crash, and the numbers
The curve: eat, and glucose rises; insulin escorts it into muscle and liver; the healthy curve returns within about two hours and waits for the next meal. The refined version — white carbs alone, liquid sugar — rises faster and higher, insulin responds harder, overshoots, and drags glucose below where it started: the crash loop — tired, foggy, craving precisely the food that repeats it. The 3pm crash isn't a character flaw; it's a curve shape.
The levers — modest, real, and stackable: the post-meal walk is the best-evidenced simple move (muscle consuming glucose during the exact window it spikes — ten relaxed minutes matter). Food order comes next: vegetables and protein before the starch slow the entire response — the sequencing trials are small but consistent. Fiber slows everything; pairing carbs with protein and fat flattens what refined carbs do alone; even vinegar carries modest evidence. And the honest shelf: cinnamon's glucose trials are mixed at modest strength; 'sugar-blocker' blends grade below that.
The numbers ladder: fasting glucose reads <100 as normal, 100–125 as prediabetes, ≥126 as diabetes; A1c reads <5.7, 5.7–6.4, ≥6.5 on the same three rungs. The middle rung is where the story turns — roughly one in three adults sits there, mostly undiagnosed, and the landmark DPP trial showed structured lifestyle change cut progression to diabetes by 58%, outperforming the medication arm. Prediabetes is not a diagnosis of doom; it's the window where the levers work hardest.
The CGM question, honestly: continuous glucose monitors went wellness-mainstream, and the data is genuinely interesting — individual glucose responses to the same meal vary meaningfully. What's unproven is the outcome claim: that flattening every curve in a healthy person improves long-term health. CGMs earn their cost in diabetes and medication management — clinical territory. For the healthy optimizer: interesting information, unproven benefit, real price. The honest middle position.
- The healthy curve returns in ~2 hours; the crash loop repeats itself.
- Post-meal walking is the best-evidenced simple lever — 10 minutes, timed to the spike.
- Vegetables and protein first, starch last: the sequencing science.
- Fasting glucose: <100 / 100–125 / ≥126. A1c: <5.7 / 5.7–6.4 / ≥6.5 — three rungs each.
- One in three adults is on the middle rung, mostly undiagnosed.
- CGMs for the healthy: interesting data, unproven outcomes, real cost.
“Blood sugar isn't a number to fear — it's a curve to flatten. Gently, meal by meal.”
— The curve principleThe factor families
The post-meal walk
Ten relaxed minutes during the exact window of the spike — muscle consuming glucose in real time.
The order of eating
Fiber and protein before starch — sequencing trials are small but consistent.
The fiber effect
Fiber slows the whole curve — legumes, greens, and whole grains doing structural work.
The numbers ladder
Fasting glucose and A1c read the three rungs — the ladder that turns 'I feel fine' into measurable.
Explore Diabetes →The story, frame by frame


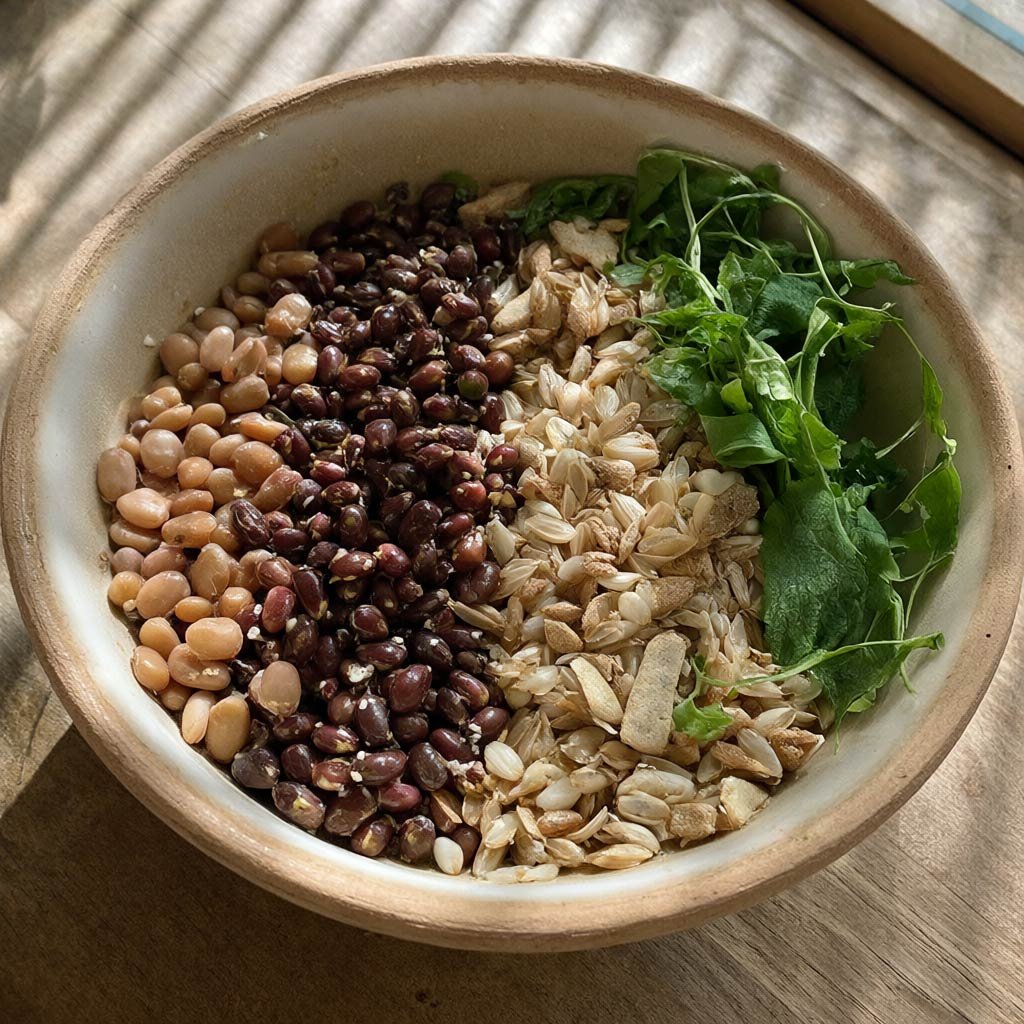
The curve's players — and the route into each
Every card links to a full BodyFinds journey. The system-level view and the endpoint's condition journey live in their own chapters.
The ladder's endpoint — the full condition journey: symptoms, severity, evidence, management.
conditionThe system page — markers, insulin resistance as state, the DPP's 58% in full.
research-topicThe most-hyped glucose supplement — real but modest trials, small-sample caveats, interaction profile.
supplementThe classic blood-sugar claim — the category's most inconsistent trial base.
supplementThe quiet associate — intake tracks with metabolic risk in observational research.
supplementThe pairing lever — protein-first meals flatten responses; the sequencing science.
supplementThe endpoint's full journey
The complete BodyFinds diabetes condition journey — the symptoms, the severity scale, the evidence chapters, and the management story.
Where this information comes from
- CDC — About Prediabetes Government
- NIDDK — Insulin Resistance & Prediabetes Government
- NCCIH — Cinnamon Government
- MedlinePlus — A1C Test Government
- WHO — Diabetes Government